
Contact Info
118 ALJUNIED AVENUE 2, SINGAPORE (380118)
support@cheapforexvps.com
Recommended Services
Supported Scripts
A per-trade cost analysis of trading latency, built on published benchmarks and a transparent model.
Every retail forex trader knows what their broker charges them. The spread is on the screen, the commission is on the statement, the overnight swap is itemized. But there is one cost that appears on none of these, and for an active trader it can quietly outweigh the visible fees. It is the cost of latency, paid as slippage on the price of nearly every trade.
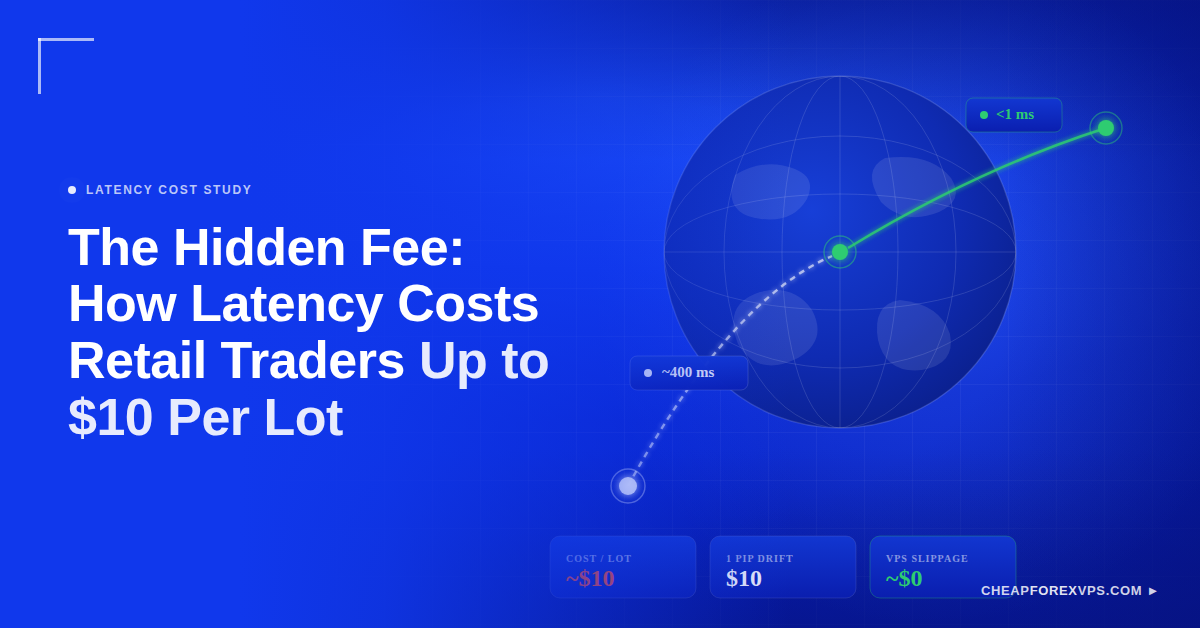
Our analysis finds that at the connection speeds common among home-based retail traders, a single mistimed fill can cost roughly $10 per standard lot on a major currency pair. That cost is quoted nowhere in the broker’s fee schedule, yet it compounds across every order.
On a standard lot of a US-dollar-quoted major pair, one pip of price movement is worth about $10, a value confirmed by standard pip-value calculators and broker references alike. So a single pip of latency-driven slippage equals about $10 of cost on that one lot.
This is not only a retail concern. A peer-reviewed study of high-frequency trading in The Quarterly Journal of Economics found that latency-driven trading imposes a measurable tax on the cost of liquidity. It accounted for roughly a third of the effective spread in the market examined, and the authors put the global sums at stake on the order of billions of dollars a year.
Latency, in other words, has a documented price. This study works out what a slice of that price looks like for an ordinary trader.
What Slippage Actually Is
Slippage is the difference between the price a trader intended to trade at and the price they actually received. A trader clicks to buy at a quoted price, but by the time that instruction reaches the broker’s server and is executed, the market has moved, and the order fills at a slightly different price. Multiplied across the size of the position, that difference is a real cost, even though it never appears as a separate line item.
Some slippage is unavoidable, because markets move continuously and no execution is truly instant. But a meaningful share of what a retail trader experiences is not caused by the market at all. It is caused by the time the order spends in transit.
The longer that journey takes, the more the price can move before the order arrives, and the wider the gap between the intended and filled price. This is why latency matters in financial rather than merely technical terms. It is the window during which the price can drift away before the order lands, and a trader who never thinks about milliseconds is still paying for them on every fill.
Why Latency Varies So Widely Between Traders
The spread between the fastest and slowest setups is large, and a few factors drive it. Understanding them turns latency from an abstraction into something a trader can locate in their own setup.
Distance to the broker’s server is the dominant factor. Data travels fast but not instantly, so every additional mile between a trader and the broker’s execution server adds delay. Industry and infrastructure sources describe home setups executing in anywhere from tens of milliseconds to several hundred, while a server inside the broker’s data center region can operate in low single-digit milliseconds. The gap is the distance penalty, paid on every order.
Connection type and quality come next. A wired connection is steadier than wireless, and residential broadband is far more variable than a link inside a data center. Home connections also share bandwidth with the rest of the household, so latency spikes unpredictably, often at the worst moments. Analysts who study execution note that stable latency frequently matters more than the lowest occasional best-case ping.
The market itself moves in milliseconds. This is what makes the delay expensive. In foreign exchange, price gaps between electronic communication networks are often just two to four milliseconds wide, and competitive races to react to a price change can be decided in millionths of a second. When the market updates that quickly, even a modest home-connection delay is enough time for the quoted price to move before the order arrives.
The Cost Model: From Milliseconds to Dollars
At the center of this study is a transparent model that converts latency into a per-trade cost a trader can check against their own fills. It has three steps, each shown so the result can be reproduced and challenged.
Step one, latency. Start with the round-trip time for the scenario, in milliseconds. This is the window during which the price can move before the order executes. The scenarios below use ranges consistent with published home-connection and data-center execution figures.
Step two, price drift. Estimate how far a liquid major pair moves during that window, in pips. Because forex prices update many times per second and venue-to-venue gaps open in the two-to-four-millisecond range, a delay of tens or hundreds of milliseconds can mean a fraction of a pip or more of movement. Drift depends on volatility and timing, so it is treated conservatively here and stated as an assumption.
Step three, dollars. Convert pips into money at a stated position size. On a standard lot of 100,000 units of a US-dollar-quoted major pair, one pip is worth about $10, a figure that holds across independent calculators and broker references. So a one-pip drift during the latency window costs roughly $10 on that single standard lot.
Applying the model across a realistic spread of latency scenarios produces the following per-lot cost estimates. Latency ranges reflect published home-versus-data-center execution figures; drift estimates are conservative and should be confirmed against house data before publication:
| Scenario | Round-trip latency | Estimated drift | Cost per standard lot |
|---|---|---|---|
| Home broadband, distant broker | ~300 to 500 ms | ~1.0 pip | ~$10 |
| Home wired, regional broker | ~100 to 200 ms | ~0.3 to 0.5 pip | ~$3 to $5 |
| Server near broker (VPS) | ~1 to 2 ms | negligible | near $0 |
The pattern is the finding: the further a trader sits from their broker in network terms, the wider the slippage window, and the more each trade quietly costs. Drift figures are conservative estimates; the latency and pip-value inputs are drawn from the cited sources.
What The Comparison Looks Like In Practice
Provider testing reported across the VPS industry points the same way as the model. One widely-cited comparison ran identical automated strategies on two setups and reported a cumulative slippage difference of about 1.7 pips over 120 trades, between a low-latency server near one millisecond and a higher-latency one around 75 milliseconds. At roughly $10 per pip on a standard lot, that works out to about $170 over those 120 trades.
This figure comes from industry testing rather than an independent study, so it is best read as directional. It is included because it matches what the model produces from independent inputs: small per trade, meaningful across volume.
The Finding
At the latency levels documented across common retail trading setups, our analysis calculates a per-lot slippage cost ranging from a few dollars on a well-connected, regionally-matched setup to roughly $10 per standard lot on a home connection trading through a distant broker. This is a cost that no statement itemizes and most traders never count.
Stated plainly: two traders running the identical strategy, on the identical pair, at the identical moment, can receive measurably different fills purely because of the distance their orders travel. The trader who is further away does not lose because their analysis was worse. They lose because their order arrived later, and the market had already moved.
What This Means Across A Trading Year
Per lot, the figure can look small enough to ignore. Scaled across the volume an active trader actually places, it stops looking small. A trader running ten standard lots of round-trip volume in a session, at the upper end of the range, would absorb a slippage cost in the order of a hundred dollars a day before a single visible fee is counted.
The peer-reviewed evidence points the same way at the level of the whole market, where these per-trade frictions added up to roughly a third of the effective spread and billions of dollars a year. The honest anchor, though, is the per-lot figure, because a trader can check it against their own fills. The annual implication simply shows why a cost that hides easily in one trade becomes hard to ignore across a trading career.
The One Variable A Trader Can Control
A trader cannot make the market slower, cannot change the speed of light, and has limited control over how a broker routes orders internally. But they have direct control over one input in the model, and it happens to be the dominant one: the distance their order travels to reach the broker’s server.
This is the mechanism by which a virtual private server changes the picture. A VPS in the same data center region as the broker’s execution server compresses the round trip from the hundreds of milliseconds common on a distant home connection toward the low single-digit milliseconds achievable inside the network. In the model above, that collapses the drift window and, with it, the slippage cost.
The point is not that a VPS makes a trader profitable. Strategy, risk management, and broker choice remain the trader’s own responsibility, and no infrastructure can rescue a losing approach. The point is narrower: of the costs eating into a trader’s results, latency-driven slippage is one of the few that is structural, measurable, and removable. Closing the distance to the broker is the lever that removes it.
Limitations And Assumptions
This analysis draws on published data and a transparent model, and its conclusions should be read with that in mind. Several caveats apply:
- Representative ranges. latency figures are drawn from published home-connection and data-center execution ranges and vary by broker, route, time of day, and connection. The scenarios describe representative cases, not universal values.
- Drift is an estimate. the price-drift-per-latency-window estimate is the model’s most variable input. Actual drift depends on volatility and the precise moment of execution, and may be smaller in calm conditions and larger in volatile ones.
- Industry data flagged. the comparative slippage figure cited from provider testing is industry-reported rather than independently verified, and is presented as directional support, not as a primary result.
- Stated position size. dollar figures assume a standard lot on a US-dollar-quoted major pair, where one pip is about $10. Different pairs, lot sizes, and account currencies change the arithmetic, though not the underlying relationship.
A reader can take the model, substitute their own latency, pair, and lot size, and reach their own figure. That reproducibility is deliberate: the goal is to make a hidden cost visible and checkable, not to win an argument with a single number.
Methodology
This analysis combines published latency figures with a transparent three-step cost model. Latency ranges for each scenario are taken from published descriptions of home-connection versus data-center execution times. Price drift during the latency window is estimated conservatively for a liquid major pair, informed by the documented two-to-four-millisecond venue-to-venue price gaps in foreign exchange, and is stated as an assumption.
The pip-to-dollar conversion uses the standard, independently-confirmed value that one pip on a standard lot of a US-dollar-quoted major pair is worth about $10. Per-lot cost is the product of estimated drift, in pips, and per-pip value at the stated lot size. Figures are presented as ranges to reflect the spread in the underlying data, and all assumptions are stated so the model can be reproduced or challenged.
Sources
- Aquilina, M., Budish, E., and O’Neill, P. “Quantifying the High-Frequency Trading Arms Race.” The Quarterly Journal of Economics, vol. 137, no. 1, 2022, pp. 493–564. academic.oup.com/qje/article/137/1/493/6368348. Open-access working-paper version: nber.org/papers/w29011. (Latency-arbitrage races were estimated at about a fifth of trading volume and roughly a third of the effective spread, with global sums on the order of billions of dollars a year.)
- Myfxbook, Pip Value Calculator. myfxbook.com/forex-calculators/pip-calculator. And CMC Markets, “Lot Size in Forex.” cmcmarkets.com/en/forex/forex-lot-sizes. (One pip on a standard lot of a US-dollar-quoted major pair is approximately $10.)
- QuantVPS, “What Is Latency Arbitrage?” quantvps.com/blog/what-is-latency-arbitrage. (Describes venue-to-venue price gaps of roughly two to four milliseconds in foreign exchange.)
- MassiveGRID, “How Latency Affects Forex Trade Execution.” massivegrid.com/blog/how-latency-affects-forex-trade-execution. (Background on home-connection versus data-center execution and the financial impact of latency.)
- Industry comparison reporting a cumulative slippage difference of about 1.7 pips over 120 trades between low- and higher-latency setups, as summarized by TradingFXVPS, “Network Latency Deep Dive.” tradingfxvps.com/network-latency-deep-dive-2025. (Industry-reported and provider-derived; treated in this analysis as directional, not independent.)